Elena Humeniuk
PPM Consultant
The challenge of creating a PPM dashboard
PMO directors often have a hard time creating a PPM dashboard where they can get a glance at key project parameters. Due to this challenge, it becomes hard for them to make sense of their data and drive project parameters.
Dashboards are powerful visual tools when used correctly. You can confidently rely on them to support decisions, saving you significant time. Furthermore, they improve processes and can bring a problem to your attention when it arises.
However, the challenge is that PMO directors often do not have the skills and resources to build an effective project portfolio management dashboard. Project leaders make crucial mistakes when aiming to create dashboard. These mistakes prove to limit the effectiveness of the dashboards and could even negatively impact the entire initiative.
Some specific factors can cause the low value of project portfolio dashboards. They include complicated dashboard design tools and lack of knowledge of how to proceed. That calls for an easy-to-use portfolio visualizer like DataMart.
What can help you create a portfolio or project-level dashboard in seconds?
A project-level dashboard forms as a basis for showcasing key performance indicators about the project. The metrics dashboard provides essential information regarding the project’s progress and overall performance. It can also highlight particular problems that need your team’s attention. As a PMO, you need these kinds of dashboards because they help monitor your project’s success.
Project-level dashboards are specific to particular project objectives. Companies of any size will need these dashboards designed to concentrate on particular processes that align efforts and performance.
DataMart helps create a portfolio or project-level dashboards in seconds.
How to build a PPM dashboard in DataMart?
Before building a project reporting dashboard or portfolios in DataMart, it’s necessary to complete a few steps. As DataMart is used as a middleware for Power BI reporting on Microsoft Project Online, you need to establish a connection directly from Project Online to Power BI with basic authentification. Along with this connectivity, you can get a reports pack for Power BI to report on Project Online data. It includes over 25 pre-built reports, such as:
- Portfolio management (overview, summary, timeline, details, workflow, etc.)
- Project management (work, status, risks & issues, work & cost, etc.)
- Resource management (utilization, allocation, engagements, assignments, etc.)
- Time management (timesheet history, compliance, and more)
- Quality management (portfolio governance, history update)
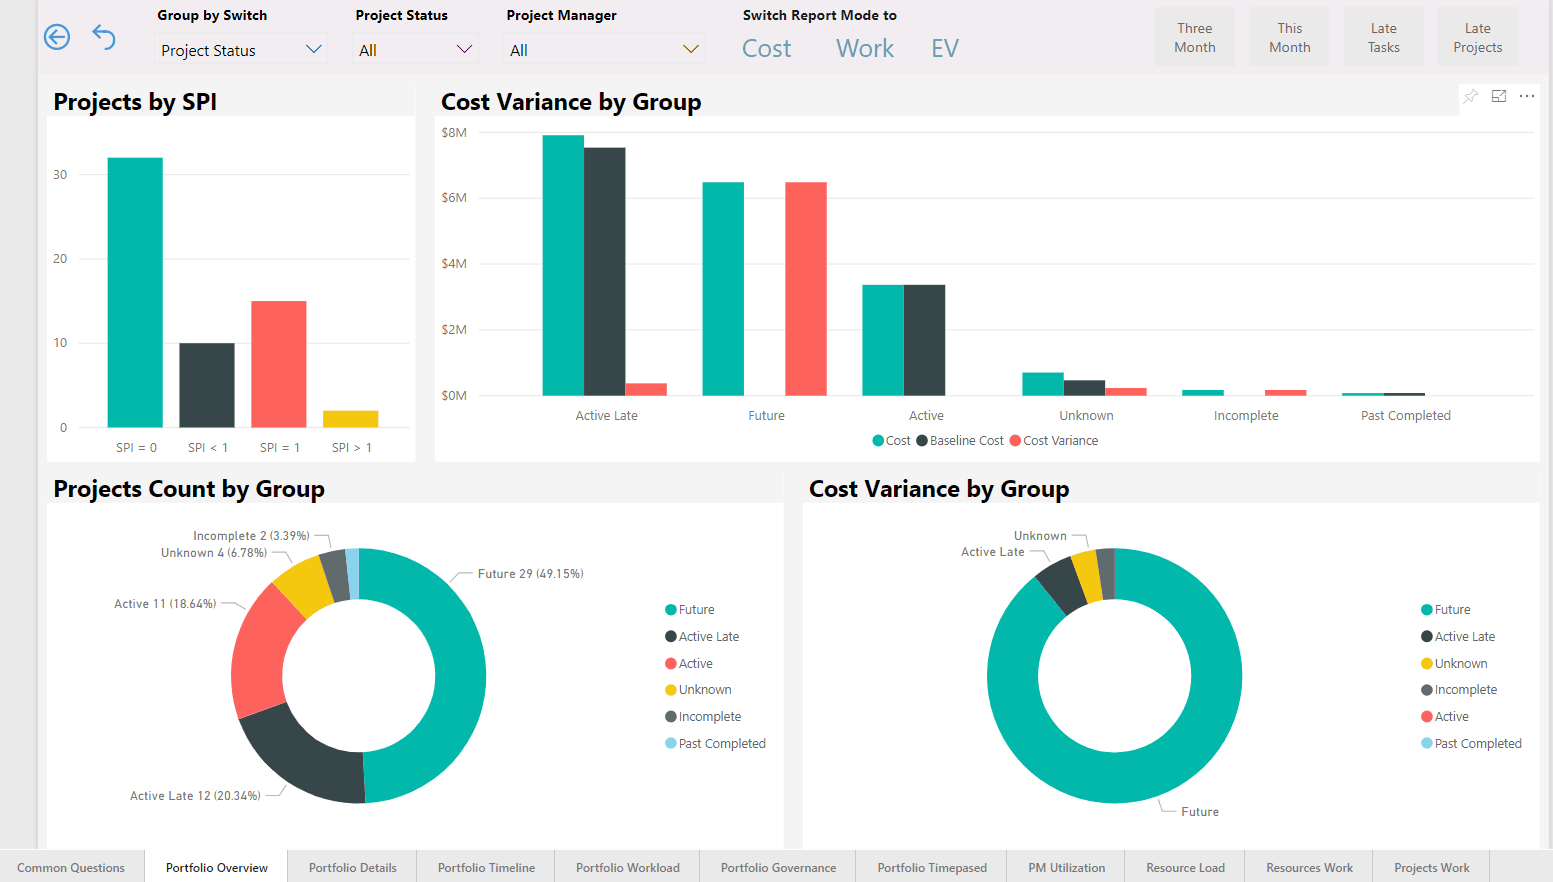
FluentPro Power BI reporting solution for Microsoft Project Online carries simple reporting and easy PPM data visualization. It allows PMO directors to gain all the needed insights for smart and data-driven decision-making. PPM activities, risk forecasting, deliverables, financial trends, and more details can be generated into reports.
This product is flexible and customizable. So, any changes or a new PPM dashboard creation can be made quickly and easily.
Here is an overview of the necessary steps for portfolio creation:
- Establish the DataMart connection directly from Project Online to Power BI so you can get all the information that needs to be reported. After this, all data can be also transformed or cleaned.
- After sourcing the data, you can access numerous built-in visualization elements, such as charts, histograms, tables, maps, cards, and more. You can change desired parameters like color, background, borders, or others.
- If you don’t have a standard set, you can upload custom visuals.
- Choose the necessary visuals and enjoy your great visualization result.
But be aware that there’s a danger of getting lost among an enormous number of visualization opportunities. Too many visuals on one page can complicate the work and make it too difficult to find the necessary information. So, here comes a useful feature to create a new page in your PPM report with the “Create page” button.
Data Visualization Software Main Benefits
Most companies underestimate data visualization value. However, report creation can influence business matters significantly. PMO directors get a clear understanding of project performance, namely, workflow, time spent on projects, cost information, and more. So, here are the main business values of FluentPro DataMart usage:
- It creates daily snapshots, enabling the monitoring historical data in Microsoft Project Online.
- FluentPro solution implements automatic SharePoint data centralization for easy reporting.
- It also provides normalizing fields and prefilling lookup tables for faster data updates.
- This software supports full or partial data synchronization.
- Includes over 25 pre-built Power BI reports on a portfolio, resource, and project level.
Contact us
to reap the benefits of FluentPro DataMart today